
KEY FIGURES
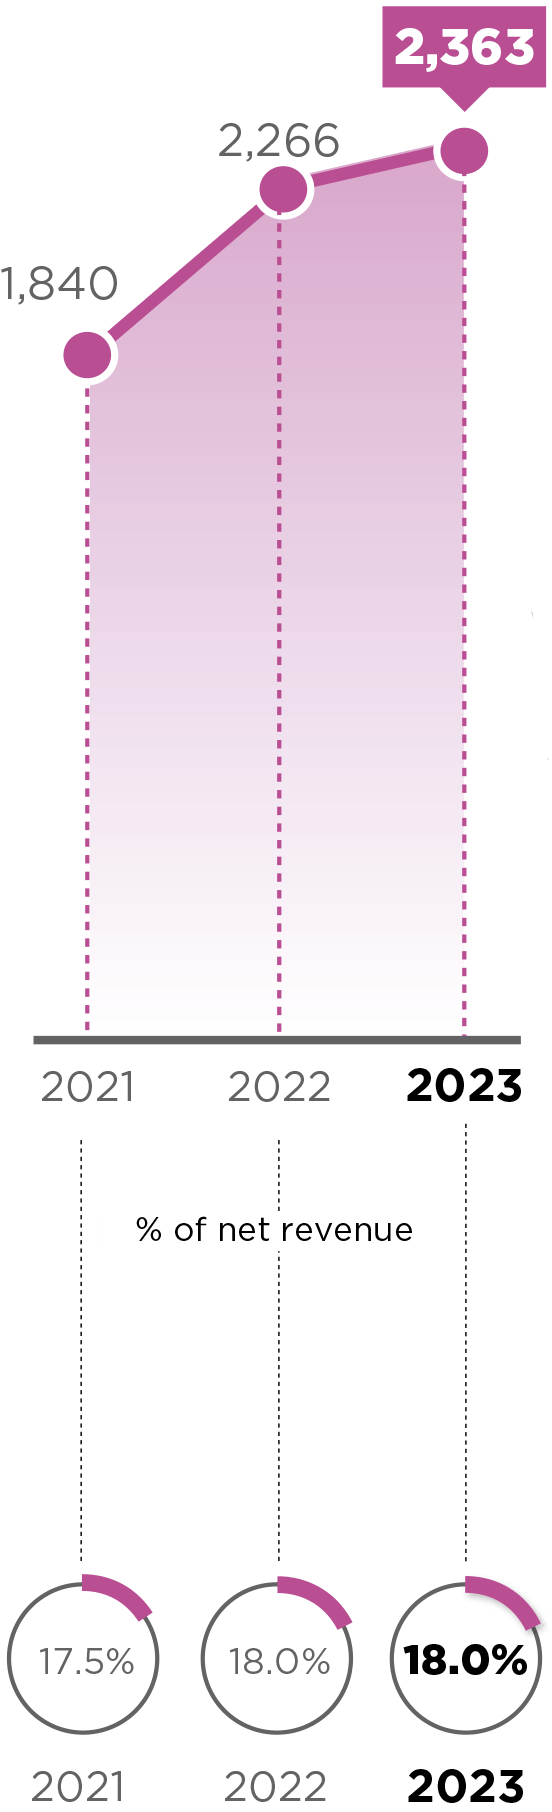
OPERATING MARGIN(1)
In millions of euros
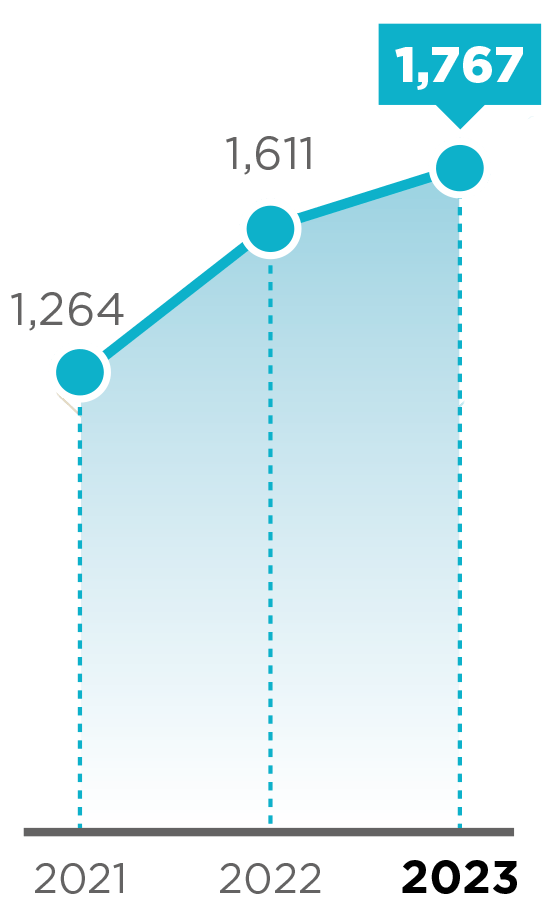
NET INCOME HEADLINE GROUPE
HEADLINE GROUPE(1)
In millions of euros
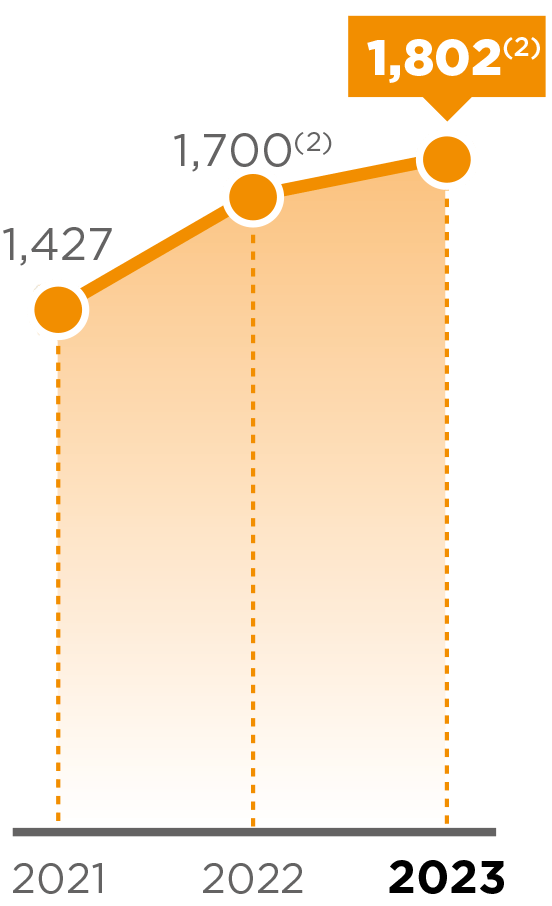
FREE CASH FLOW
BEFORE CHANGE IN WORKING CAPITAL REQUIREMENTS(1)
In millions of euros
HEADLINE EARNINGS PER SHARE – DILUTED(1)
In euros

DIVIDEND PER SHARE
In euros

PAYOUT RATIO
In %

- See definitions in the glossary at the end of the introduction.
- Reported Free Cash Flow for 2023 is euro 1,547 million after payment of euro 148 million in respect of the Rosetta settlement agreement and payment of additional tax of euro 107 million paid in January 2023 for 2022 in application of the American legislation “Tax Cuts and Jobs Act” (TCJA) on the capitalization of R&D expenses. Reported Free Cash Flow for 2022 is euro 1,807 million before payment of the TCJA tax of euro 107 million in January 2023 for 2022.
- Submitted to vote during the General Shareholders’ Meeting of May 29, 2024.
-
Groupe Profile
-
Message from the Chairman of the supervisory board
-
Message from the Chairman of the management board
-
History
-
Outlook
-
Business model
-
Value creation
-
Organization
-
Talents
-
Key figures
-
Stakeholders
-
Governance
-
Glossary
-
1. Presentation of the groupe
-
2. Risk and Risk management - AFR
-
3. Governance and Compensation - AFR
-
4. Corporate Social Responsibility Non-Financial Performance - AFR
-
5. Commentary of the Financial Year - AFR
-
6. Consolidated Financial Statements 2023 Year - AFR
-
7. Parent Company 2023 Financial Statements - AFR
-
8. Company Information and Capital Structure
-
9. General Shareholders' Meeting
-
10. Additional Information